

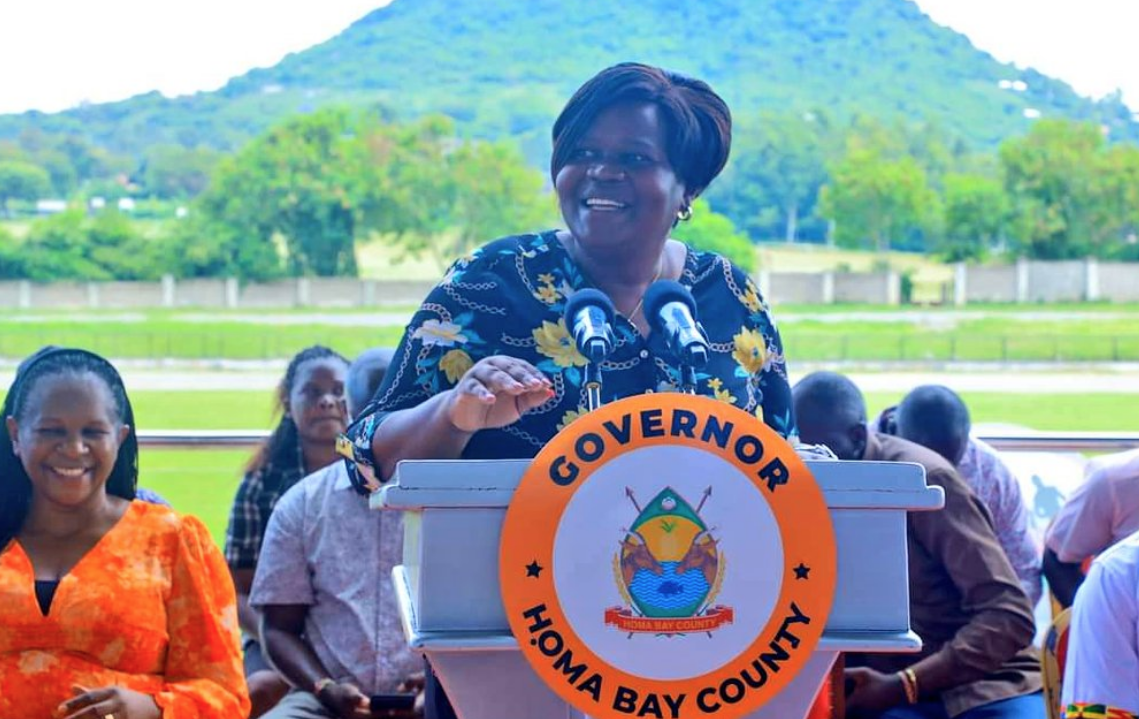
Homa Bay County Chief Gladys Wanga has been ranked as the top-performing female governor in 2024.
A survey by Infortrak Research and Consulting shows that overall, Wanga was the third-best-performing governor scoring 61 per cent behind George Natembeya (64 per cent) and Irung’u Kang’ata (68 per cent).
Countytrak Performance Index 2024 put Fatuma Achani as the second best performing female governor, who was in position 11 overall scoring 52 per cent.
Kirinyaga County boss Anne Waiguru was the third-best-performing female governor scoring 50 per cent. She was position 14 overall.
Machakos governor Wavinya Ndeti and her Meru counterpart Kawira Mwangaza were fourth and fifth, scoring 48 and 45 per cent respectively. Overall, they ranked 18 and 24 respectively.
Embu governor Cecily Mbarire was the sixth best performing female governor scoring 44 per cent and was position 27 overall.
Wanga was also the best-performing governor in the Nyanza region, followed by Anyang’ Nyong’o (Kisumu), Simba Arati (Kisii), Ochillo Ayako (Migori) and James Orengo (Siaya).
She was second overall in Lake Region Economic Bloc which comprises Nyanza and Western region.
Infotrak Research developed the CountyTrak Performance Index
to provide Citizens’ scorecards of their County governments against set key
performance indicators.
The current index was conducted between October – December 2024 covering all 47 counties, 290 constituencies and 1450 wards with an overall sample of 39,795.
Data was collected through Computer Assisted Telephone Interviews (CATI).
The questionnaire was structured using a 1-10 Likert scale being applied on each indicator where 1 was very poor and 10 was excellent.
The mean was computed for each Sub-Indicator of the Key Performance Indicators (KPI) to get the Index for that Specific KPI.
The Overall County performance Index was then computed by taking the average of the KPIs.